Exploring the ‘what if?’ of climate risk: Moody’s RMS
‘There are perils where the science is strongly indicative that climate change is underway, and there are perils where the science is not yet clear about that link,’ chief research officer at Moody's RMS, Robert Muir-Wood, says

Chief research officer at Moody’s RMS says the modelling firm is examining seven 'potential' catastrophe scenarios, arguing that recency bias focused on actual events can colour the perceptions of catastrophe risk managers
Locating the interface between climate change and catastrophic risk depends on the ability to model future events, according to the chief research officer at Moody's RMS, Robert Muir-Wood.
In an interview with Insurance Day, Muir-Wood says that the notion there are primary and secondary perils is a convention established by reinsurers. Scientists do not make such a distinction.
“We don’t use the terms primary peril and secondary peril because the boundaries between them are not clear. There is often overlap between them, which means a severe convective storm in one region could lead to a flood in another, as has occurred recently in Libya,” he says.
Reinsurers refer to natural events such as flood or wildfire as secondary perils because they are perceived as less severe than primary perils, such as hurricane and earthquake. Aggregated losses from secondary perils, however, indicate the need for modelling of all weather-related and seismic events, to have a comprehensive understanding of the risks from natural disasters.
“I would make the distinction that there are perils where the science is strongly indicative that climate change is underway, and there are perils where the science is not yet clear about that link,” Muir-Wood says.
“In the US, for example, we currently model climate change factors when examining flood, wildfire, and hurricane but not for severe convective storms. It’s not that we’re confident that there isn’t a climate change signature with severe convective storm; it’s just that we don’t yet know what form that signature takes. Is it by spatiality, severity, frequency, or all of these?”
He continues: “This year has been very active for severe convective storms in the US. There were $34bn of insured losses in the first half of 2023, which isn’t the worst on record, but it is in the top three years over the past 30 years of activity.”
Scientists believe the heightened activity this year is linked to the very warm winter in the south-west US, and that the end of El Niño also had some effects. Differentiating the impact of climate change from the impact associated with the El Niño-Southern Oscillation is not easy, however.
“We’re heading into a fairly strong El Niño right now, which may dominate the climate perils for the next six to nine months and be a stronger forcing factor than climate change itself,” Muir-Wood says.
Getting to know the unfamiliar
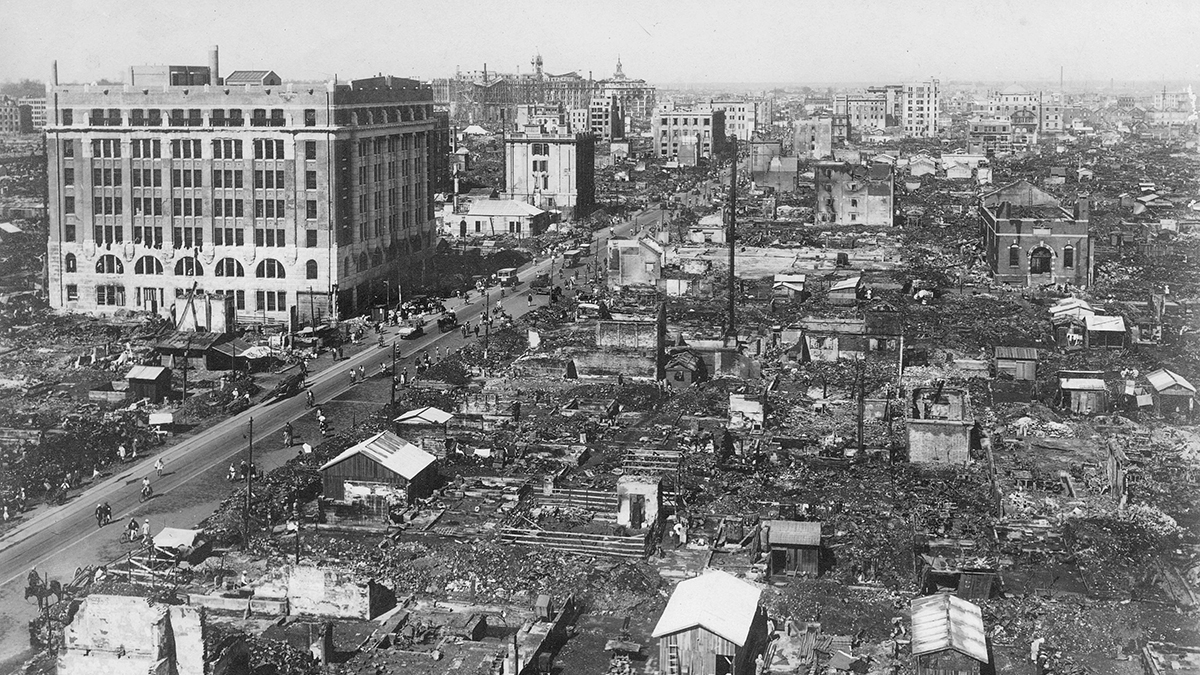
Moody’s RMS recently highlighted seven “less familiar” potential catastrophe examples. It argues that recency bias focused on actual events over the past 10 or 20 years, their locations, impacts, and consequences, is a predisposition that can apply to many catastrophe risk managers. These seven examples include a re-creation of the Great Hurricane of 1780 through the Caribbean.
A problem with re/insurance, he says, is its short-termism – insurance policies are typically written only for one year and insurance-linked securities contracts for about three.
“Our clients are interested in looking into the future, because the future may turn up faster than they anticipated, as has happened with California wildfire, and also because they want to anticipate the next five, 10, 15 years.”
Science is a vast discipline, so what is the best source of a climate crystal ball?
"Our clients are interested in looking into the future, because the future may turn up faster than they anticipated, as has happened with California wildfire, and also because they want to anticipate the next five, 10, 15 years”
Moody’s RMS has a range of climate-conditioned peril models that focus on four representative concentration pathways (RCP), from now to the end of the century. An RCP is a greenhouse gas concentration (not emissions) trajectory adopted by the Intergovernmental Panel on Climate Change (IPCC). The RCPs 2.6, 4.5, 6, and 8.5 are labelled after a possible range of radiative forcing values in the year 2100.
“The IPCC does a very good job of synthesising well-respected scientific work to establish a baseline of consensus, but it does that only every few years and so things may get a bit out of date,” Muir-Wood says. Consensus on individual perils is not always clear, he adds.
On tropical cyclone and hurricane, for example, there is more consensus among scientists that the overall number of the peril events is anticipated to reduce but their mean intensity is expected to increase. There is also the suggestion that storms are slowing down and moving to higher latitudes, which means their precipitation level will be greater.
“There are components of our understanding that are pretty well established, and there are other components that are exploratory at this point,” Muir-Wood says.
Global model
International sharing of data is particularly relevant for earthquake.
Muir-Wood explains that as seismic detection instruments may be used a long way from an earthquake, global monitoring and data sharing for this peril has been in operation for many decades. The United States Geological Survey, for example, provides information within hours and sometimes even minutes of an earthquake – where it is, its extent, the level of ground shaking, and expectation of casualties.
For flood, exploration is becoming easier with improvements in technology, such as the use of drones and satellite imaging, he adds.
“Our clients expect detailed data from us to assist them in anticipating what their losses will be in the aftermath of a significant flood, and we have a team that reconstructs a footprint of the event within several days of its occurrence. There is nothing that an international agency on flood data could bring beyond what we are already doing.”
Moody’s RMS has more than 300 scientists, half of whom have PhDs in hydrology, seismology, and climatology, and so on, to help re/insurers make sense of catastrophic events, and their frequency and severity, but what about the protection gap?
“We invest in our models, we build and license them on the basis that there is an insurance market with the appetite for underwriting risk,” Muir-Wood says.
“Rich countries have access to detailed catastrophe modelling, but low-income countries do not. In order to make sense of loss and damage, wealthy countries could set up insurance processes whereby they support the premium for catastrophe risk in the developing world.”
“Rich countries have access to detailed catastrophe modelling, but low-income countries do not. In order to make sense of loss and damage, wealthy countries could set up insurance processes whereby they support the premium for catastrophe risk in the developing world”
To that end, Moody’s RMS anticipates that, within the next few years, it will have the capability to model the main perils “for the whole world”. It has already launched Global Flood Maps and Data in 2021, which cover 100% of global gross written premium. The motivation for this ambition was that flooding is a truly global peril that can occur in any country with both significant humanitarian and financial implications.
There are “yawning” gaps in public-private initiatives on climate risk for those who are the most vulnerable to climate risk, Muir-Wood says. For example, the Caribbean Catastrophe Risk Insurance Facility Segregated Portfolio Company is efficient and makes payments rapidly, but it is funding only 1% to 2% of the total loss from a catastrophic event, he adds.
So how can we strengthen the arm of the World Bank and other organisations grappling with the impacts of natural catastrophes on the global poor?
Muir-Wood stresses: “The modelling capability we are developing could become the catalyst to enable more solutions to be found to help fill the protection gap. That will be the hope.”
Evolution of modelling
Catastrophe risk modelling has come a long way since its inception at the end of the 1980s. RMS produced its first North Atlantic hurricane model in 1995 and recently issued version 23 of this, which reflects increased attention on the exposure and vulnerability aspects of that peril.
The first flood risk model from RMS appeared in 2001, and high-definition (HD) flood models now cover more than 30 countries and model 80% of gross written flood premium.
For flood risk, Moody’s RMS has recently unveiled version 2 of its HD flood models, which presents an improved global digital terrain model as a foundational component of flood modelling. Using very recent datasets from Copernicus GLO-30 DEM, provides high-precision elevation data combined with robust and innovative machine-learning techniques, to smooth and correct for artifacts like buildings and vegetation.
This helps modellers understand the Earth’s bare surface and which areas are more susceptible to flooding than others.
Moody’s RMS always has an eye on the “outliers”, Muir-Wood says. These include European wildfire.
“It has been assumed the risk of this is so low that there is nothing to worry about, but certainly we are getting to a point where European wildfire will need to be a consideration for reinsurers,” he says.
The biggest wildfires in Europe so far have been in Portugal and Greece, where they have affected rural areas with very low insurance take-up and properties – old farmsteads – of low value.
“We build models only where there is an interest in pricing the risk and so a European wildfire model is not on our agenda, but we will be watching it,” Muir-Wood says.
“We are on top of the situation for countries with an insurance industry, so the OECD [Organisation for Economic Co-operation and Development] countries. The future will be about expanding our risk modelling capability to low-income countries.”
Moody's Corporation completed its acquisition of RMS in August 2021 and the idea for developing global catastrophe risk modelling came from this new link, he says.
“At RMS, we know how to build models for a wide range of perils and Moody’s, with its very large footprint of contacts in the finance and business world, brought its ambition of global coverage of climate risk to us.”
He continues: “The initiatives we’re doing in terms of our Moody’s RMS Climate OnDemand point data solution means, within a year or two, we’ll be able to announce some form of global coverage for additional relevant perils. There probably won’t be a big fanfare when we launch it, as our clients test different parts of it, but it will significantly help with what we call the catastrophe perils.”
The essence of this development is twofold, Muir-Wood concludes. First, to see a regional event in its global context and second, to “blend” the catastrophe and climate change perspectives to enable the pricing of risk transfer for the developing world.